


Get to Know a Feature: Dialog Wave Browser
Created on August 4 at 11:28 am - by: admin
This is the first post of our new "Get to Know a Feature" series, in which we highlight some of the new and changed features in Igor Pro 7.
Today I'll cover some of the changes to what we call the dialog wave browser, which is used in the Data Browser and many other dialogs in which waves (or sometimes variables, strings, or data folders) are selected.
Macintosh users: If you don't see the gear and question mark buttons, you will need to go to System Preferences, select General, and choose "Always" for the "Show scroll bars:" setting.
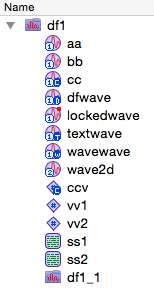
You can learn a lot about an object from its icon. Waves have circular icons, variables diamond icons, and strings rectangular icons. Data folders are represented by a folder icon. The dimensionality of waves is indicated by a number in the lower left corner of the icon. The data type of waves is indicated by a letter in the lower right corner: C for complex, T for text, W for WAVE reference, D for DFREF (data folder reference), and nothing for real numeric waves. Similarly, complex variables are indicated by a C in the lower right corner. Locked waves have a red dot at the upper right corner of the icon. For data folders a red arrow overlay on a data folder icon indicates the current data folder and a white arrow indicates that the current data folder is a child of a data folder.

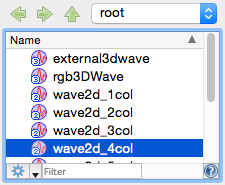
The data folder whose contents are currently displayed in the object list below is always shown in the popup button. You can select a different data folder from the popup to view the contents of that data folder in the list below, though doing so does not change Igor's current data folder. The Up button moves the display up one data folder (towards root:). The left and right buttons move back and forward, similar to how the Back and Forward buttons work in a web browser.
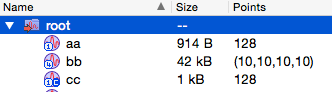
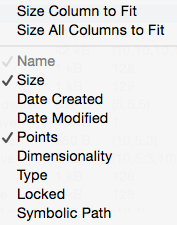
A new feature of the Igor Pro 7 dialog wave browser is the ability to display additional columns of information, including size, date created, date modified, points, dimensionality, type, lock state, and symbolic path (most of these fields apply only to waves). To enable display of additional columns, right click on the header and select the column you wish to display. You might then want to right click again and select Size All Columns to Fit so that you can see all columns at once.
Clicking on an individual column in the header sorts the objects in the list by that column. You can reverse the sort order by clicking the same column's header again.
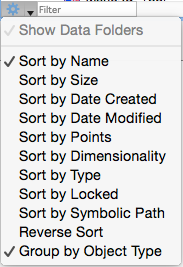
Sorting and grouping of the objects is controlled from the settings button.
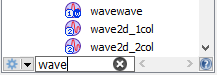
The list of objects can be limited to objects whose name matches the pattern entered in the Filter control.
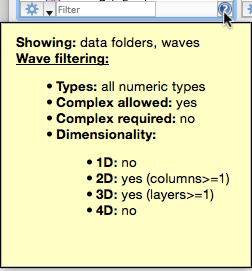
In some cases the objects displayed in the object list must meet some criteria. For example, in the New Image dialog, the Z wave must be either a 2D or 3D wave. To see what filtering criteria is being applied, click the question mark button at the lower right corner. A popup will be displayed that indicates the current filtering criteria.

Forum

Support

Gallery
Igor Pro 9
Learn More
Igor XOP Toolkit
Learn More
Igor NIDAQ Tools MX
Learn More