


Get to Know a Feature: Color Table Wave Basics
Created on September 27 at 12:01 pm - by: admin
Igor 7 has an easy-to-miss addition: the ability to use a wave as a color table that can be re-used for different ranges.
Igor 6 has only color index waves, where each color is tied to the image, trace, or contour's "z value" through the color index wave's X Scaling. This works well if you want a specific color to always correspond to a certain Z value.
But if you want to re-use the same color wave to cover different Z value ranges (like you can with Igor's built-in color tables such as Rainbow or Grays), with Igor 6 you'd need one color index wave for each different Z value range.
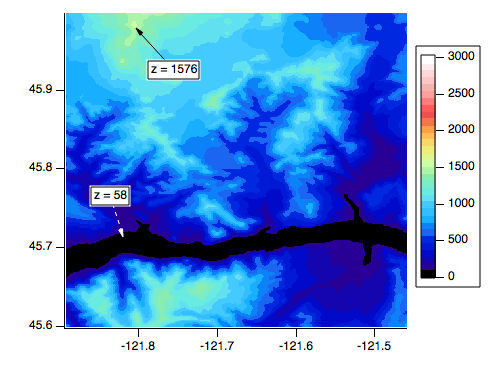
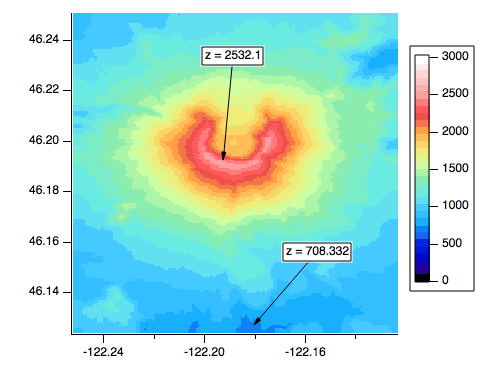
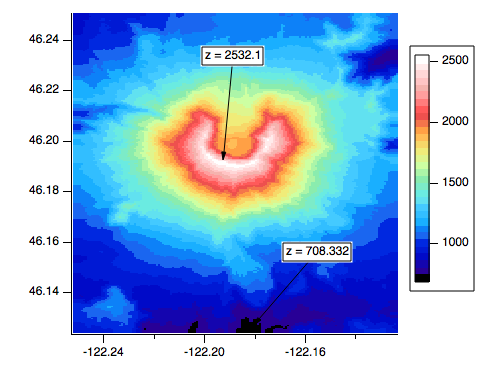
Here are two image plots sharing one color index wave based on the built-in Geo32 color table.
Note that in the first graph some of the colors aren't used, since the numeric range of the image is less than the 0-3000 X scaling of the shared color index wave:
To use the full range of colors in each image plot you could create duplicate color index waves, assigning different X scaling appropriate to each image plot's Z data range, or you could use the new Color Table Wave option.
Color Table Wave is a new Color Mode option in the Modify Image Appearance dialog:
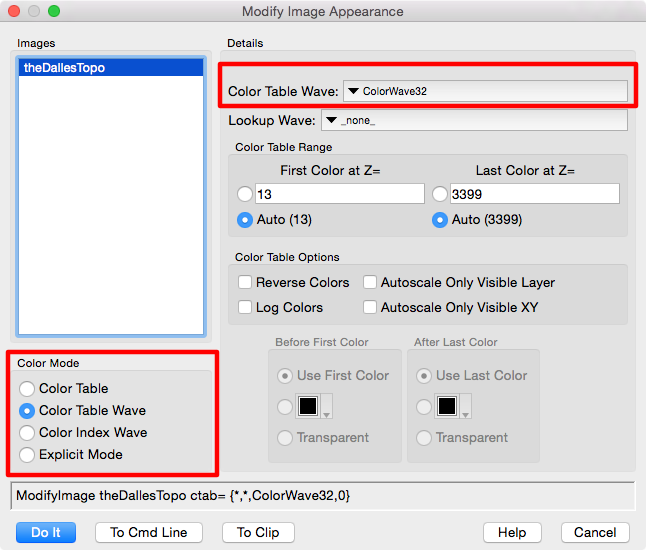
Here we're altering the theDallesTopo image plot to use ColorWave32 wave as a color table wave instead of a color index wave.
Notice that the First Color at Z= and Last Color at Z= controls are operable just like they are for a built-in color table such as Rainbow or Grays.
Here are the same two image plots now using ColorWave32 as a color table wave:
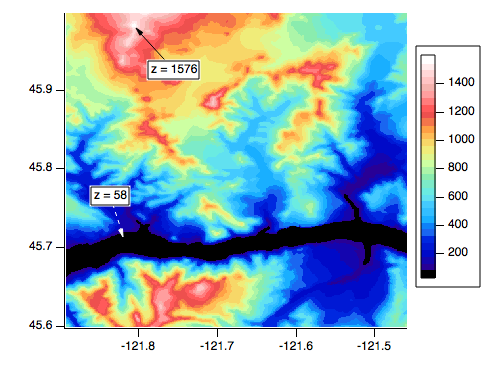
Now both image plots use the full range of colors in the shared color table wave.
The import of this is that now you can create just one wave with your custom colors and use it in multiple plots, just like Igor's built-in color tables, for image plots, contour plots, and graph f(z) traces.
So, how can you create color table waves? There are many options:
- Use #include <ColorWaveEditor>
- Import a CSV data file into a matrix or separate waves and transform it into a 3 column RGB wave or a 4 column RGBA wave, one color per row.
- Write a function to create the color table wave.
- Capture a color table from a screenshot and approximate it using the color sampler and an experiment that creates gradients between color samples, like the gradient editor in a Photoshop-like program.
We'll cover most of these in another "Get to Know a Feature" article, but for now let's use what is perhaps the simplest method.
CREATING A NEW COLOR TABLE
The color index/table wave in the example above was created using Igor's Color Wave Editor.
#include <ColorWaveEditor>
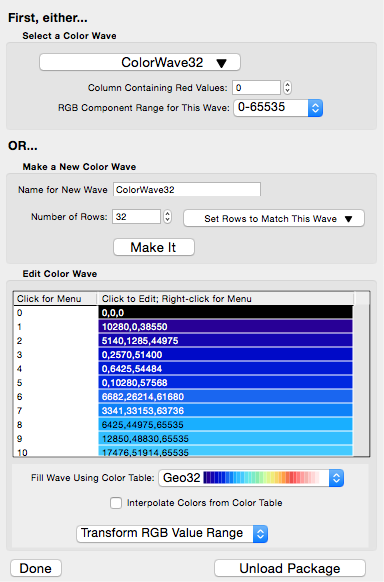
ColorWave32 was created to be a version of Geo32 with the first color replaced by black (by clicking the first row and choosing a new color from the color popup menu).
The wave is created with default X scaling, which is fine when using it as a color table wave.
Color index waves, as discussed before, use X scaling unique to each application.
TO BE CONTINUED...
In "Get to Know a Feature: Color Table Wave Creation", we'll show you how to recreate a color table from a screen capture of an existing color table, from a CSV data file, and from a published algorithm.

Forum

Support

Gallery
Igor Pro 9
Learn More
Igor XOP Toolkit
Learn More
Igor NIDAQ Tools MX
Learn More